This is sorta a weather blog isn't it? It's about time I share a weather photo. For this week's photo of the week, my first tornado! This tornado was spotted near Groom, TX along Interstate 40 on a storm chase on April 22, 2010. This particular tornado was only on the ground for a few seconds, and was rated EF0 since it basically did not cause any damage.
Meteorology: A large cutoff low was noted on 500 mb analysis, with a surface dryline in place over the Texas Panhandle. The morning SPC convective outlook had a large Slight Risk area over much of the High Plains, including a 10% significant tornado probability over the Texas Panhandle. It should be noted that under today's SPC outlook conventions, this would have been an "Enhanced Risk". The outlook text noted that supercells capable of very large hail were likely to develop along the dryline, with the tornado risk increasing during the early evening hours as a low-level jet developed. At 2:35 p.m. CDT, SPC issued a Tornado Watch for the Texas Panhandle. At 3:00 p.m. CDT, SPC upgraded their outlook to a Moderate Risk with a 15% significant tornado probability. The first tornadoes (in Texas) were reported just after 5:00 p.m. CDT (including the one in the photo above). By the end of the day, there would be 12 preliminary tornado reports, with additional tornadoes reported in Colorado, Kansas, and Oklahoma.
500 mb analysis valid 1200 UTC (7:00 a.m. CDT) April 22, 2010
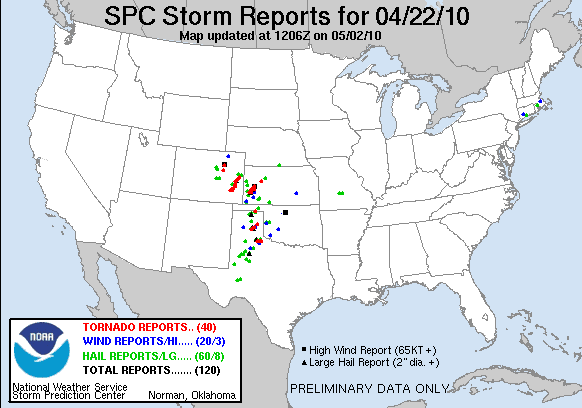
Preliminary storm reports for April 22, 2010
The Chase: At the time of this chase, I was in my sophomore year at the University of Oklahoma. The chase team included Stefan Rahimi (now a postdoctoral scholar at UCLA) and Curtis Riganti (now a climatologist at the National Drought Mitigation Center). We departed Norman around 1 p.m. (which was cutting it close!), and headed west on I-40. The initial target was Shamrock, TX. As we headed west, we monitored NOAA Weather Radio and what little we could get over cellular data networks. In 2010, cellular data networks was kinda just starting to be a thing, but it generally consisted of fairly slow 3G and AT&T "Edge" (ahh, those were the days!). We approached the first supercell right on I-40. A prominent wall cloud was noted, and multiple funnel clouds were spotted.
Wall cloud associated with the first supercell
Funnel cloud beneath the wall cloud
A few minutes later, the first tornado (photo at the top) occurred. By the end of the day, our team would see three tornadoes.
Tornado #2, partially wrapped in rain near McClellan Creek National Grassland
Tornado #3 north of I-40 near McLean, TX
It was quite awesome to see these first three tornadoes. Up until this point, I had only seen tornadoes in photos and videos. In fact, I had not even really seen a classic supercell in person. Growing up in South Louisiana, a true classic supercell was fairly rare. It was so cool to finally see what this looked like in person. Finally, below is a video taken by my friend Curtis, primarily of the first supercell and tornado.
Introduction With all the California wildfires in the news, and questions over whether these fires can be attributed to climate change, human activity (e.g. arson), or forestry management, I decided to take a look at the trends in the number of Red Flag days over the past few decades. "Red Flag" conditions are weather conditions that when combined with critical fuels (e.g. dead trees, grass build-up, etc.) and an ignition source (e.g. lightning, an ill-placed cigarette butt, etc.), will foster rapid fire growth. In general, the two main things you need for rapid fire growth are low humidity and high winds. The criteria for the National Weather Service to issue a Red Flag Warning will vary depending where in the country you are, and the criteria may be eased (either direction) a bit depending on fuels. For example, a local weather forecast office (WFO) may issue a warning below criteria if fuels are really primed (such as during a severe, long-term drought). Conversely, a WFO ...
As of the 10 a.m. CDT advisory, Tropical Storm Barry has maximum sustained winds of 65 mph and minimum pressure of 998 mb. This represents an increase in winds of 15 mph, and a drop in pressure of 7 mb since this time yesterday. Manual surface analysis valid at 10 a.m. CDT Friday showing Tropical Storm Barry. The forecast has not changed that dramatically during the last 24 hours. The official forecast track continues to bring the center of Barry near the Louisiana coast in the vicinity of Morgan City on Saturday morning as a category one hurricane. After landfall, the center should track roughly along the U.S. 90 corridor, bringing it near or just east of Lafayette, then into Central Louisiana. Barry should weaken after making landfall. NHC Official Forecast Track issued at 10 a.m. CDT Friday. The main concern with Barry continues to be rainfall. The slow-moving nature of Barry, combined with already wet soil conditions and high rivers in South Louisiana will result in a v...
Over the next several days, I will be chronicling a roadtrip through Colorado I took during the last week of September and first few days of October 2020. It had been a longtime "bucket list" item to see the aspens in Colorado during the fall, and I finally got to check this item off the list. It did not disappoint! The trip consisted of about seven days of camping and hiking in Colorado. While I reside in Fort Worth, the trip was "based" out of Norman where some friends and I met up. The purpose of this blog will be to recount some of the routes taken, sights seen, lessons learned, experiences that were had, and some of the challenges of a roadtrip amidst the COVID-19 pandemic. For this post, I start with "Day 0" as the day I drove from Fort Worth to Norman to prepare for the actual trip, as well as "Day 1" which is the drive out from Norman to Trinidad, Colorado. The dates covered here are September 25-26, 2020. The gang consisted of former Uni...


Comments
Post a Comment